How to debug a java program in Eclipse
Debugging is a must-have skill for any java developer. Having the ability to debug java program enables to find you any subtle bug which is not visible during code review or comes when a particular condition offer, This becomes even more important if you are working in high-frequency trading or electronic trading system project where time to fix a bug is very less and bug usually comes on the production environment and doesn't appear in your Windows XP machine. in my experience debugging the java applications also helps you understand the flow of the java programs.In this java tutorial, we will see how to debug a java program, setting up remote debugging in java, and some java debugging tips on Eclipse and Netbeans IDE. It’s also good to know various java debug tools available and how java debugger or jdb works but it’s not mandatory for doing debugging in Java.
To start java debugging you just needs your project to be configured in a modern IDE like Eclipse and Netbeans and you are ready to debug the java program.
Btw, if you are a beginner, I suggest you to first go through a beginner course like Eclipse Tutorials for Beginners to understand the core concepts of Eclipse IDE and get yourself familiar with UI and essential features. Learning plugins will be a lot easier after that.
Java debugging tools
I prefer Eclipse over NetBeans because of its seamless integration with remote debugging because most of the time your application will run on a Linux machine and you might not have a local version running on your machine, in such a scenario remote debugging is extremely useful.
You can check how to set up java remote debugging in eclipse for step by step guide on setting remote debugging in eclipses. Apart from Eclipse and Netbeans IDE, you can also use Java debugger jdb which is a simple command-line-based java debugger and based on java platform debugging architecture and can be used to debug java programs locally or remotely.
Suspend=y and n is quite useful for debugging from start or debugging at any point.
% java -Xdebug -Xrunjdwp:transport=dt_socket,address=8000,server=y,suspend=n StockTrading
After starting your java application in debug mode you can attach java debugger "jdb" to the VM with the following command:
% jdb -attach 8000
You can check the jdb manual page for complete detail on how to do java debugging with jdb.
Java debug options
If you are not using any IDE for java debugging locally you need to provide java debug option while starting your program. You need to provide java debug option also if you are setting up remote debugging session or using jdb for java debugging. Following are the two java debugging option which needs to be provided to java program:| Debug Options | Purpose |
| Xdebug | Used to run java program in debug mode |
| Xrunjdwp:transport=dt_socket,server=y,suspend=n | Loads in Process debugging libraries and specifies the kind of connection to be made. |
Using jdb to debug java application
1) Start your java program with two options provided above for example, below command will start StockTrading java program in debug mode.% java -Xdebug -Xrunjdwp:transport=dt_socket,address=8000,server=y,suspend=n StockTrading
After starting your java application in debug mode you can attach java debugger "jdb" to the VM with the following command:
% jdb -attach 8000
You can check the jdb manual page for complete detail on how to do java debugging with jdb.
Java remote debugging with eclipse
This is another cool feature of eclipse which allows you to connect your java application running on remote host and do remote debugging. You just need to start your java application with the java debug option discussed above and then connect your application from eclipse into specified port. You can check below link for step by step guide on java remote debugging with eclipse.Debugging Java Program in Eclipse and Netbeans
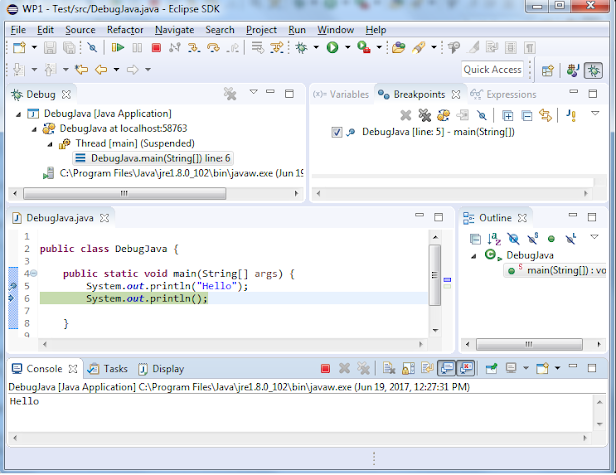
Debugging java application locally on any IDE like Eclipse or Netbeans it’s very simple, just select the project and click debug or use debug shortcut provided by IDE. You can also debug a single java class with the main method. In Eclipse just right-click and select "Debug as Java Application".10 practical Java debugging tips
Now let's see some java debugging tips that I used while doing debugging in Java in Eclipse.1. Use conditional breakpoint
Eclipse allows you to set up a conditional breakpoint for debugging a java program, which is a breakpoint with a condition and your thread will only stop at the specified line if the condition matches instead of just stopping on that line like in the case of line breakpoint.To set up a conditional breakpoint just double click on any line where you want to setup a breakpoint and then right click --> properties and then insert the condition.
Now the program will only stop when that particular condition is true and the program is running on debug mode.


2. Use Exception breakpoint
How many times you have been frustrated with a NullPointerException and you don't know the source from where the exception is coming from. Exception breakpoints are just made for such situations. Both Eclipse and Netbeans allow you to set up an Exception breakpoints.You can setup Exception breakpoints based on java exception like NullPointerException or ArrayIndexOutOfBoundException. You can setup Exception breakpoint from breakpoint window and your program will stop when you start it on debug mode and exception occurs.

3. Step over, Step Into
These are simply great debugging options available in any Java IDE, extremely useful if you are debugging multi-threaded application and want to navigate step by step.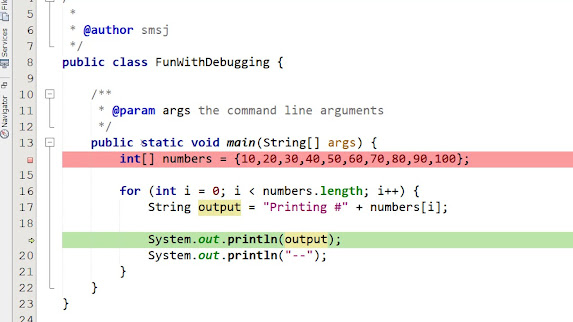
4. Stopping for a particular Thread
This is my own custom-made java debugging tips which I made using conditional breakpoints. since most of my projects are multi-threaded java programs and I want only a particular thread to stop on a particular line, for doing that I setup a conditional breakpoint on that line and put Thread.currentThread().getName().equals("TestingThread") and it works fantastically.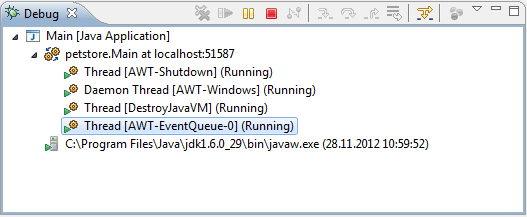
5. Inspect and Watch
These are two menu options which I use to see the value of expression during debugging java program. I just select the statement, right click and inspect and it will show you the value of that statement at debugging time. You can also put watch on that and that condition and its value will appear on watch window.
6. Suspending and resuming thread
You can suspend and resume any thread while debugging java program from debug window. Just right click on any thread and select either suspends or resume. This is also very useful while debugging multithreading program and simulating race conditions.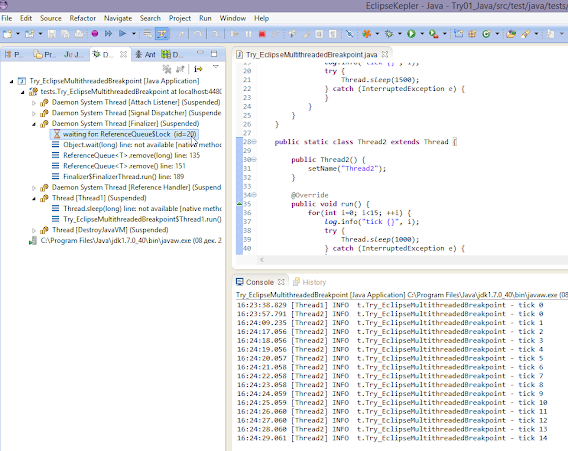
7. Using the logical structure
The logical structure option is very useful for examining contents inside java collection classes like java hashmap or Java Arraylist during java debugging. The logical view will show the contents like key and value of hashmap instead of showing full details of hashmap which we may not be interested in, you can enable and disable logical view from variables window.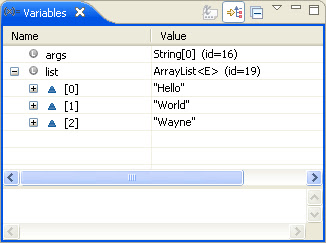
8. Step filtering
When we do Step Into on process debugging java program control goes from one class to other and it eventually goes to JDK classes like System or String. Sometimes we just to remain in our application and don't want to navigate into JDK System classes in that case Step filtering is great you can just filter out the JDK class from Step into. You can set up step filtering from preferences àJavaàDebugàStep Filtering and enable and disable it from Debug window.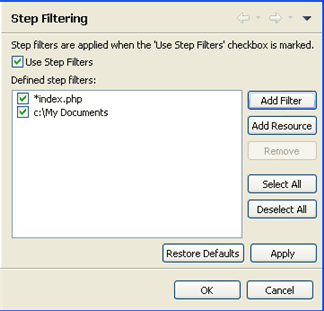
9. Copy Stack
While debugging java program if you want to copy the stack of a thread that hit the breakpoint and suspended you do so by "Copy Stack" option. Just right-click on Thread on Debug Window and select "Copy Stack".10) Last tip is use java debugging as last option and not the first option because it’s very time consuming, especially remote java debugging which takes a lot of time if network latency is very high between local and remote host. Try to identify problem by looking at code it would be very handy and quick.
lastly java debugging is real fun so definitely try it few times to get hold of it and please share some other java debugging tips you use on your daily life.
Other Java Eclipse articles you may like to explore
- 30 Useful Eclipse Shortcuts for Java Developers (list)
- How to remote debug Java application in Eclipse? (tutorial)
- 10 Eclipse debugging tips Java developer should know? (see here)
- How to attach source code for JAR file in Eclipse? (guide)
- Eclipse shortcut to print System.out.println statements? (shortcut)
- How to increase console buffer size in Eclipse? (steps)
- How to use spaces instead of tabs in Eclipse? (guide)
- How to create an executable JAR file from Eclipse? (example)
- 3 Books to Learn Eclipse IDE for Java developers (list)
- How to Increase Heap Size of Java Program running in Eclipse? (guide)
Thanks for reading this article so far. If you like this article then please share with your friends and colleagues. If you have any questions or feedback then please drop a comment.


21 comments :
Hi, I like your java debugging tutorial and in fact these are great tips on java debugging It would have been better if you include images to show the debugging steps.
Debugging in Java is quite easy in Eclipse rather than Netbeans. I found debugging feature of Eclipse quite useful than Netbeans. you can inspect, see logical structure and put watches quite easily in Eclipse. I was initially searching for how to debug Java program in Eclipse and found this great article. keep it up.
Do you happen to have tutorials on how to debug a war file in eclipse? Thanks.
Having a section on how to debug Java program in Eclipse and separate on for debug Java program in Netbeans will help your readers and also add value to the post.
Thanks for sharing Java debugging techniques. I really appreciate as you don't learn debugging overnight and it is one area which requires experience. by using your Java debugging techniques anyone can move forward. My favorite debugging technique in Java as you mentioned is setting up conditional breakpoint. Also technique of stopping any Thread is pretty useful.
@Anonymous, Thanks for your comment and glad to hear that you find this Java debugging tutorial useful. Indeed attaching source of JDK, Spring and other common library make life much easy but if you want to avoid the hassle than you can use JAD decompiler plugin in Eclipse, that will decompile class file for you.
Hi,
Thanks for your valuable posts and can you post a discussion on Repositary server and how to work with the repositary server in Real time.
Hi Javin, are you aware of any new debugging feature or tips available for Java program in Eclipse Indigo and Eclipse Juno ? I heard they introduced stopping on main as new feature on Eclipse Juno, Can you please show an example of that.
One of the useful Java debugging Tips I would like to share is keeping watch on new Exception().printStackTrace(). So when debugging thread stops on breakpoint it gives an idea from where do you come from. I often used this Tip while debugging in Eclipse and Netbeans. This is very generic tips and you can also use it on any IDE like IntelliJ IDEA.
Thanks a lot! Now I am in more love with Debugging.
But you should also mention "Change Value" option too. Which helps me a lot !
Just a note: the parameters -Xdebug and -Xrunjdwp are deprecated since Java 5, and have been replaced with -agentlib:jdwp. See the docs for the new ones:
http://docs.oracle.com/javase/7/docs/technotes/guides/jpda/conninv.html#Invocation
Very good article. I'm debugging the code using Eclipse from long time, but never knew about some of these wonderful tips. Thank you !!
In eclipse there is a hidden window called "Display", to enable it go to Window->show view->display.
Now, here is the interesting part, suppose that you wanted to know the value of variable "count" at that instant but you forgot to place a println("the value is..."+count"), well you can have the value by using the Display window.
Go to the Display window at the bottom of the IDE and inside of it type "count" (without quotes), then select what you wrote and press ctrl+shift+D, you should have a response like this
output:
count
(int) 1
Value of variable "count" can be found even in other windows like "variable" or using other options like "inspect". But another intersting advantage with this "Display" window is that, you can write piece of code (or complex code) and find the output of it at runtime. for e.g.
I know few beginners are confused to decide whether to use ".equals" or "==", similarly there might be many scenarios which we can dynamically run our code and decide which piece of code to use (or to find what is going wrong).
e.g: (you can try a good example :-))
Integer temp = new Integer(1234);
if(temp.equals(new Integer(1234)))
System.out.println(" equals option works ");
else if (temp == new Integer(1234))
System.out.println(" == option works ");
else
System.out.println(" Both doesn't work ");
Output will be displayed on the console window. Hope this helps.
One another way which I do follow is, use loggers
It is useful when we cant remotely connect our live env and some exceptions occur, which cant be regenerate in out test or local env. In such cases logs are very much useful to trace back all the steps and find out the root cause.
While debugging we can change the values of literals in values Window,it's one of the awesome features, I use it often this.
Remote debugging is VERY easy in Netbeans. Just attach debugger to the remote serve debugging port via Debug->Attach Debugger. That's it. I find it much easier than Eclipse.
Thanks, this gave me a quick start on local debugging, really very useful.
Very good post.
Thanks this is very very useful for me
@kumar rahul singh, glad that you find these java debugging tips in eclipse useful.
You can do much more with conditional break point in Eclipse. It's my preferred tool to solve complex, hard to detect bugs. I use it to insert print statement in the code without modifying JAR and deploying it on Server. You can also stop a particular Thread using Thread.currentThread() method or at any particular value of interest.
Post a Comment